Every good blog post about time issues in forensics needs a theme song.
Today’s theme song is Ain’t nobody got time for that from the local band Rubber Duc:
Having a theme song, and more importantly, embedding the Youtube video for said theme song in your blog post, serves the following two purposes:
- It keeps the reader here for 3minutes and 18seconds (when viewing it embedded on this page), which will make me and my post analytics think that they actually spent time reading through the entire article.
- Gets a song stuck the reader’s head, ideal for when you go back to writing that report you’ve been putting off all week.
Now that we got that out of the way, lets get down to the business of the day:
Identifying Time changes in Windows Event Logs with L2t:
As you’d recall from my previous post, the aim of this series is to play around with quick things you can do at the beginning of an investigation, while for example, waiting for processing to complete. Specifically, those ‘nice to know’ things that takes only a couple of minutes to check…
Time changes on a system can make a simple investigation quite complex very quickly. Sample case is often where a user backdates a system before deleting / creating files.
The following steps should be enough to give you a quick view of user initiated time changes on a system. Remember, this is only to get a high level view, just enough to let you know you need to dig deeper.
Let’s start:
Step 1
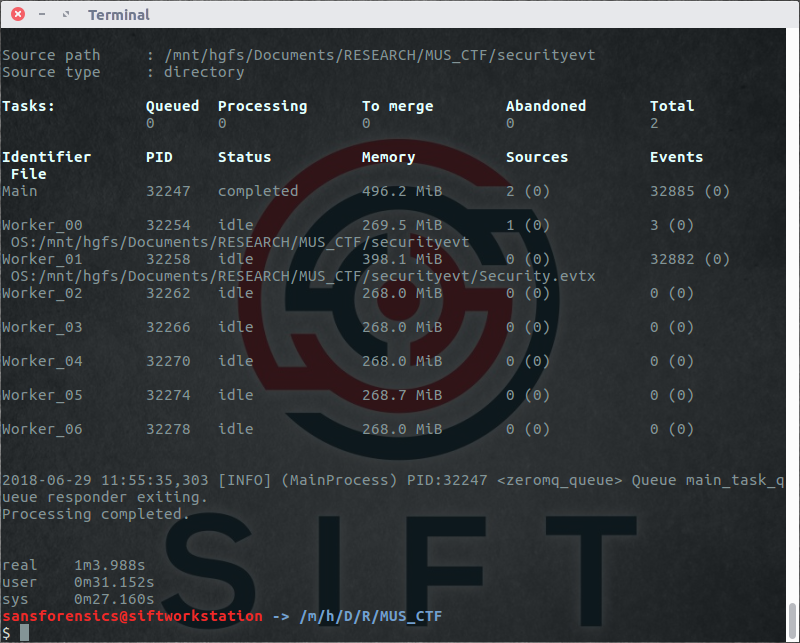
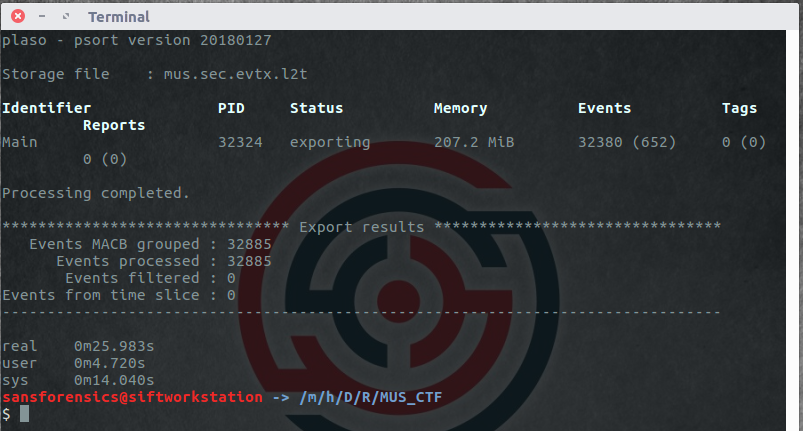
First off, we start with processing only the Security and System event logs with Log2Timeline, followed by psort-ing it using the l2tcsv output format. The reason for having a look at the Security and System event logs is that Time change events are recorded in both. Often, the Security event log is quite busy, so chances are that historical events will get overwritten a lot quicker than those in the System event log. My current Security event log has 30,000 entries, with System only sitting at 10,000.
Step 2
Now that we have an output file (in my case SecSysEvt.l2t.csv) which contains the L2T output from the Security.evtx and System.evtx, we can start Grepping.
We’ll do this in two sections:
- Dealing with time change events in the Security Event log (this post).
- Dealing with time change events from the System event log (next post)
Security Event log
When a time change occurs on a Windows 7 and later system, Event Id 4616 fires. See more about this event at Ultimate Windows Security.
So let’s get grepping:
grep Security\.evtx SecSysEvt.l2t.csv
This will gives us events in our L2T output which came from our Security.evtx file (ignoring events from the System.evtx for now). In my case I have 27,884 Security.evtx events.
Next, we want to narrow it down to only Event ID 4616. The following should do the trick:
grep Security\.evtx SysSec.l2t.csv | grep "EventID>4616"
After this, we clear out some unwanted 4616 events. In this case we are excluding events that were not caused by user action. Remember, we want to know if a user was messing around with the system time.
To accomplish this, we exclude events containing LOCAL SERVICE as well as S-1-5-18:
grep Security\.evtx SysSec.l2t.csv | grep "EventID>4616" |grep -v "SubjectUserName\">LOCAL SERVICE\|S-1-5-18"
Our output is now ready for us to only extract the columns we want. To do this we make use of awk. First up, we output only the xml section of the L2T output:
grep Security\.evtx SysSec.l2t.csv | grep "EventID>4616" |grep -v "SubjectUserName\">LOCAL SERVICE\|S-1-5-18" | awk -F"xml_string: " '{print $2}'
This gives us something like:

We now use awk to only give us the columns we are currently interested. For this scenario, I’m only looking for the following columns:
- Event ID
- User SID Responsible for the change
- User Profile Name
- Computer Name
- The process responsible for the change
grep Security\.evtx SysSec.l2t.csv | grep "EventID>4616" |grep -v "SubjectUserName\">LOCAL SERVICE\|S-1-5-18" | awk -F"xml_string: " '{print $2}' | awk -F'[<,>]' '{print $9 "\t" $57 "\t" $61 "\t" $65 "\t" $85 }'
Using this, we get the following output:

All that’s left now is some sorting and unique-ing:
grep Security\.evtx SysSec.l2t.csv | grep "EventID>4616" |grep -v "SubjectUserName\">LOCAL SERVICE\|S-1-5-18" | awk -F"xml_string: " '{print $2}' | awk -F'[<,>]' '{print $9 "\t" $57 "\t" $61 "\t" $65 "\t" $85 }'| sort | uniq -c | sort -n -r

This gives us the following:
For this event log, there were 8 time changes, resulting from user actions. 6 by SystemSettingsAdminFlows.exe and 2 by dllhost.exe.
From what I can see on my Win10 test system, SystemSettingsAdminFlows.exe is responsible for making system time changes when a user made use of the “Adjust Date\Time” option from the taskbar. I’m doing some more testing with regards to when dllhost.exe fires on Windows 10. So far I haven’t been able to replicate it…
Remember, this is just a pointer or a flag that gets raised to let you know that it might be useful to have a deeper look at time change events on a system.
Lastly, this grep should work on Windows 7 Security event logs as well (Haven’t tested it on Win8). I ran it on a couple of test Win7 systems, and it was good enough to show a specific application installed by a user was making regular time adjustments across these systems.
Next time, we’ll look at time change events in the System event log.


